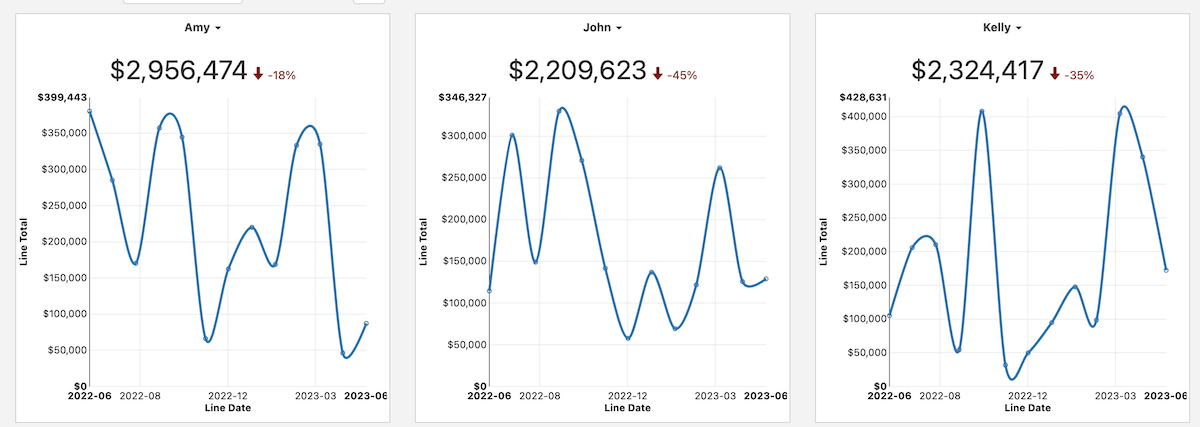
Trend charts provide a combined big number and chart view:

The chart below plots data on a time basis (month, quarter, etc), while the number at the top shows the sum or average of the data. If the report has a date filter, the chart will automatically calculate a comparison against the preceding time, so if your filter is for the last 90 days, it'll compare against the 90 days prior.
You can choose to show the chart element of the report in either a line or column form by going to Configuration -> Report Properties -> Formatting and changing the report type. You can also apply line or column chart formatting through the Formatting section.

In particular, this report type is geared towards displaying a number of metrics on a dashboard, either by doing a number of different reports for different measures or by doing a dashboard repeater to repeat the same report for a certain filter (showing sales total by sales rep, ticket total by agent, etc).
This report type is also closely tied to our simplified goal functionality. If a goal is configured, the goal line will show on this report:

For more information about simple goals, see Goals.