To start the year off, we have a variety of usability improvements and other quality of life tweaks to Easy Insight:
We've made a few usability tweaks to adding editable custom fields to your data sources. You can directly click into the custom field editor from your data source page, easily add more editable custom fields after you've created your first one, and more. For more on these changes, see Editable Custom Fields. We've also added a video to guide you through editable custom fields at https://youtu.be/qoG7cRcqP7A.
Looking to connect your Excel/CSV data with your existing data sources? We've added some usability tweaks to guide you through connecting your Excel/CSV data to your other data. For more, see Adding Excel/CSV to Other Data Sources. We've added a video for this one as well at https://youtu.be/pROTrXjXOWo.
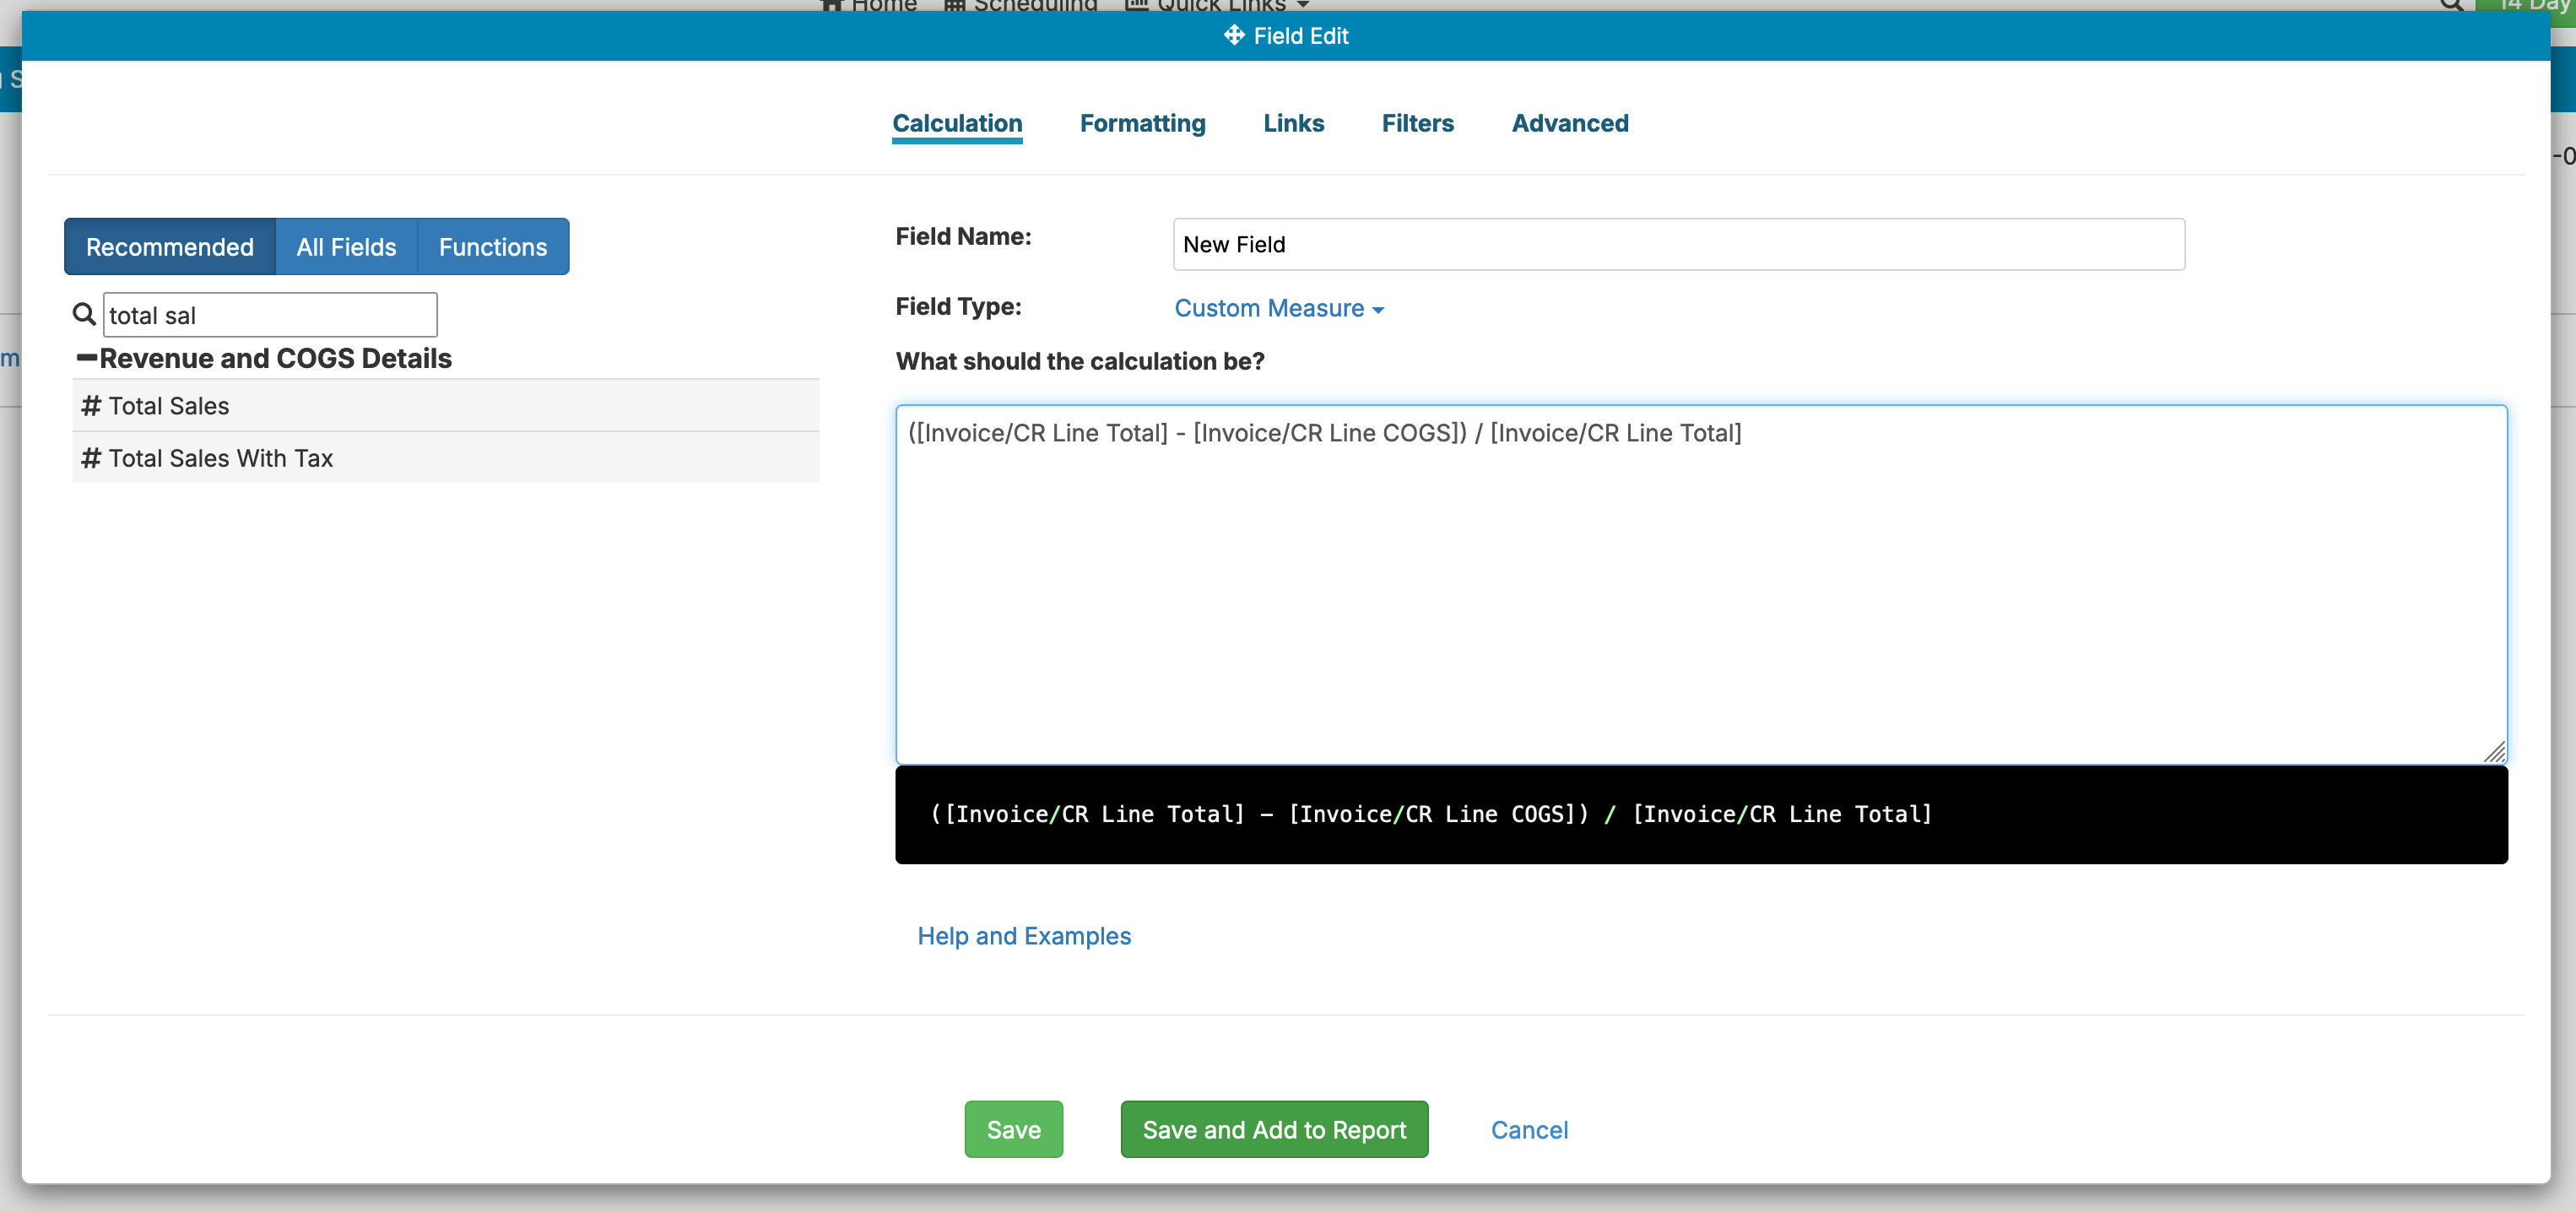
When you create a new custom field or copy a field in the report editor, you'll now see a 'Save and Add to Report' option in addition to the normal Save. You can use this option to immediately add the newly created field to your report:
We've added sub summaries for rows and columns in crosstabs. For example, if you have Year and Quarter as two levels of column in your crosstab, you can turn sub summaries on to get a per year sub summary:
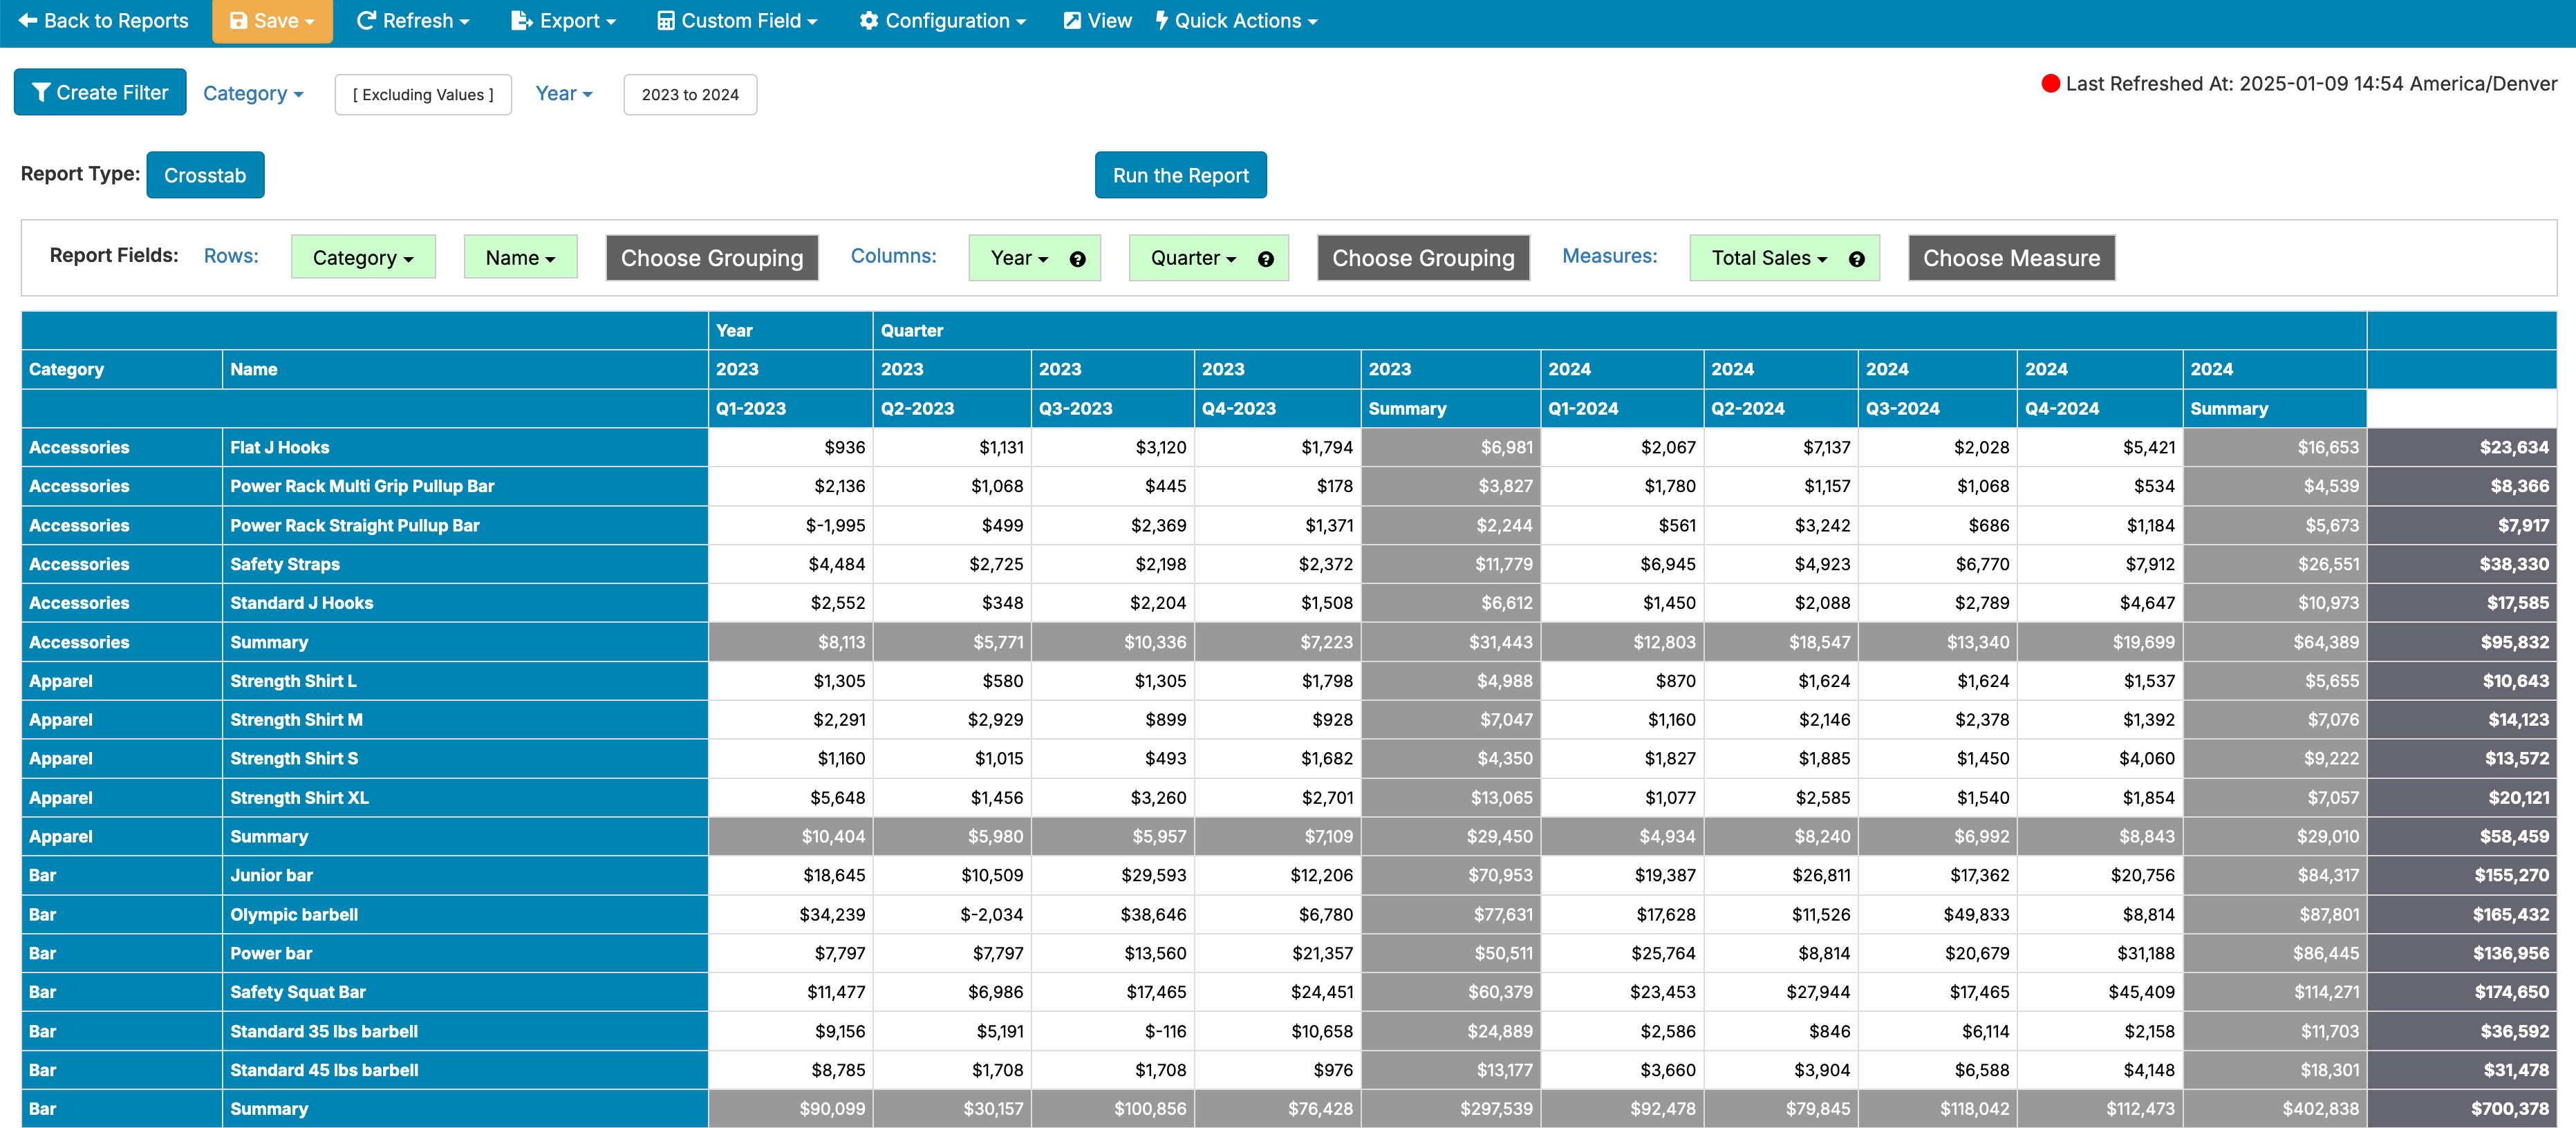
For more information on these crosstab changes, see Crosstab Reports.
When allocating variable expenses from your accounting system to contribution margin, you can now choose the field for weighting allocation and optionally add a weight field to apply a further weighting to the calculation. For example, if you have $50,000 in fulfillment costs that you need to allocate across your orders for December, you can choose to allocate that $50,000 per order, weighted by individual order total, or something else altogether. Maybe for your business, it makes sense to weight based on the physical weight of the items in the order--with this change, you can do this. For more information, see Extending Inventory Data with Accounting Costs.
Is your report looking at sales in the last 30/60/90 days, but showing 0's for various rows that have no data in the last 90 days? You can easily clean your report up with a new list report setting for hiding zero measure rows. For more information, see List Reports.
We've made changes to help with creating reports that use multiple dates. For example, if you're looking at sales compared to a goal or quantity sold compared to quantity purchased, you're using multiple date fields in your report. We've made some tweaks to help the report automatically choose the appropriate date field for you, reducing how much configuration you need to do. For more information, see Comparing Data Across Multiple Date Fields.
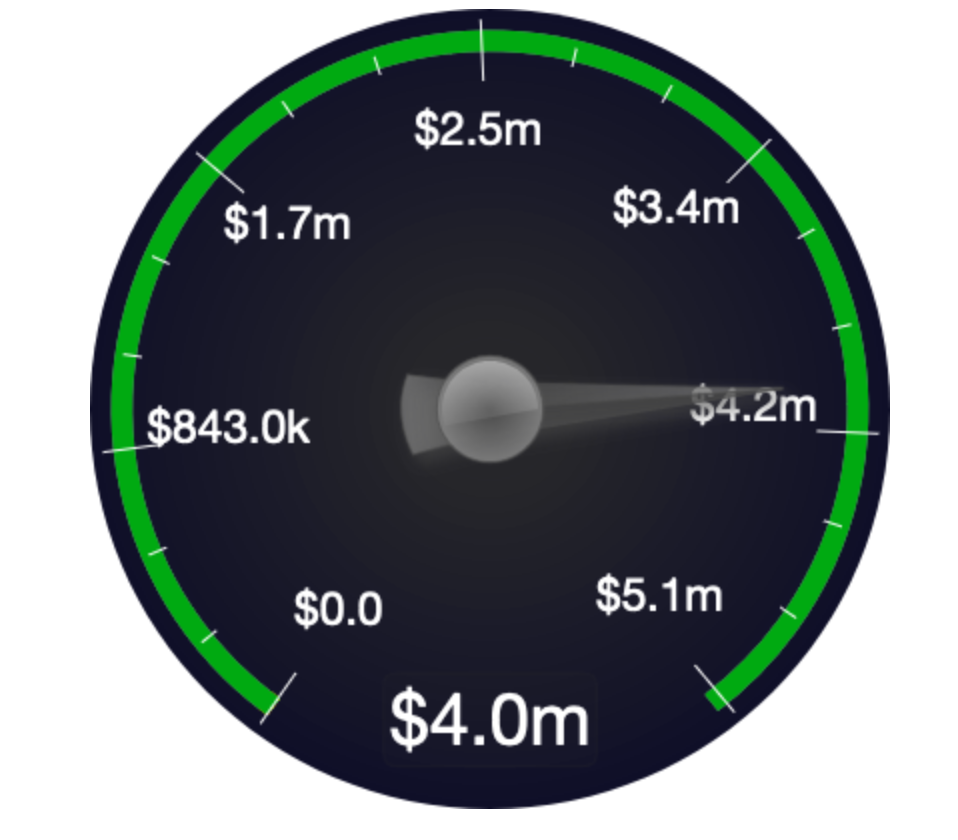
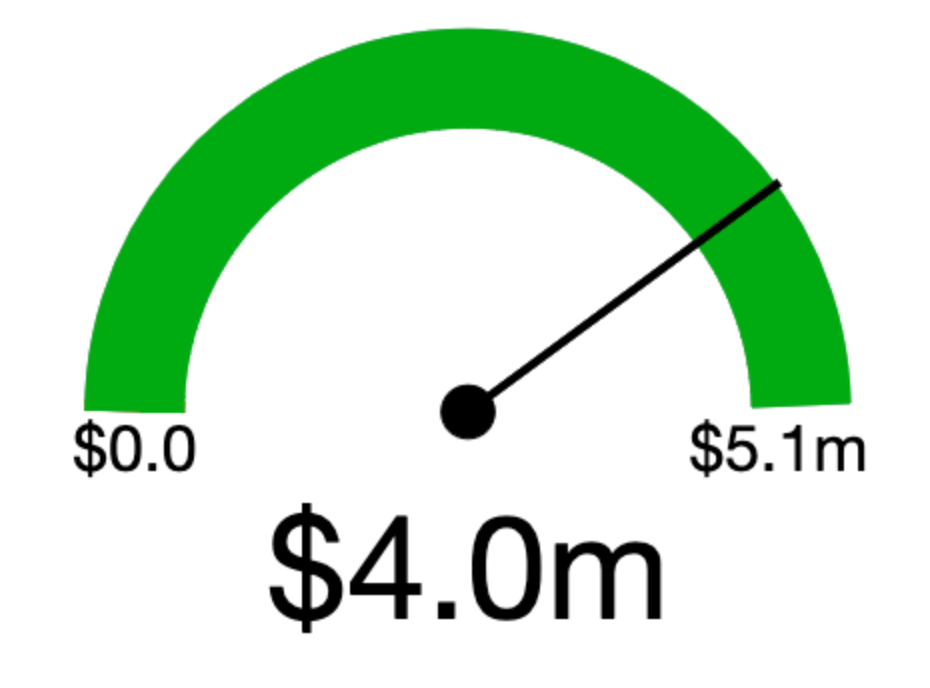
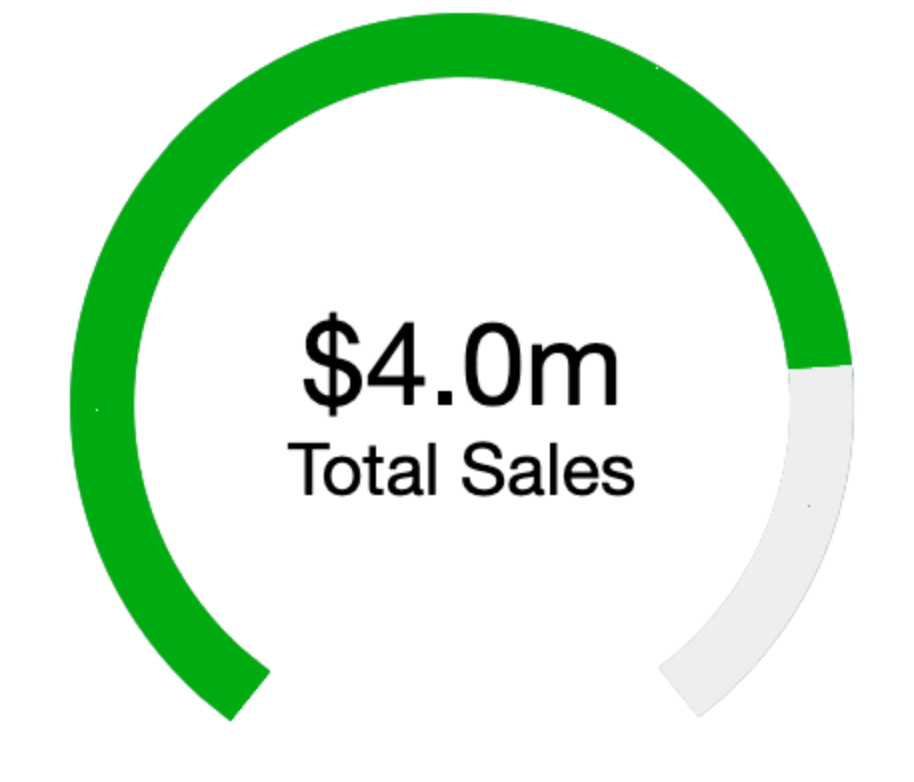
Gauges will now use the configured formatting on all tick marks. In particular, if you're using a rounded currency or measure (configured as the Formatting in the field editor for the measure), this tweak helps clean up the appearance of the gauge:
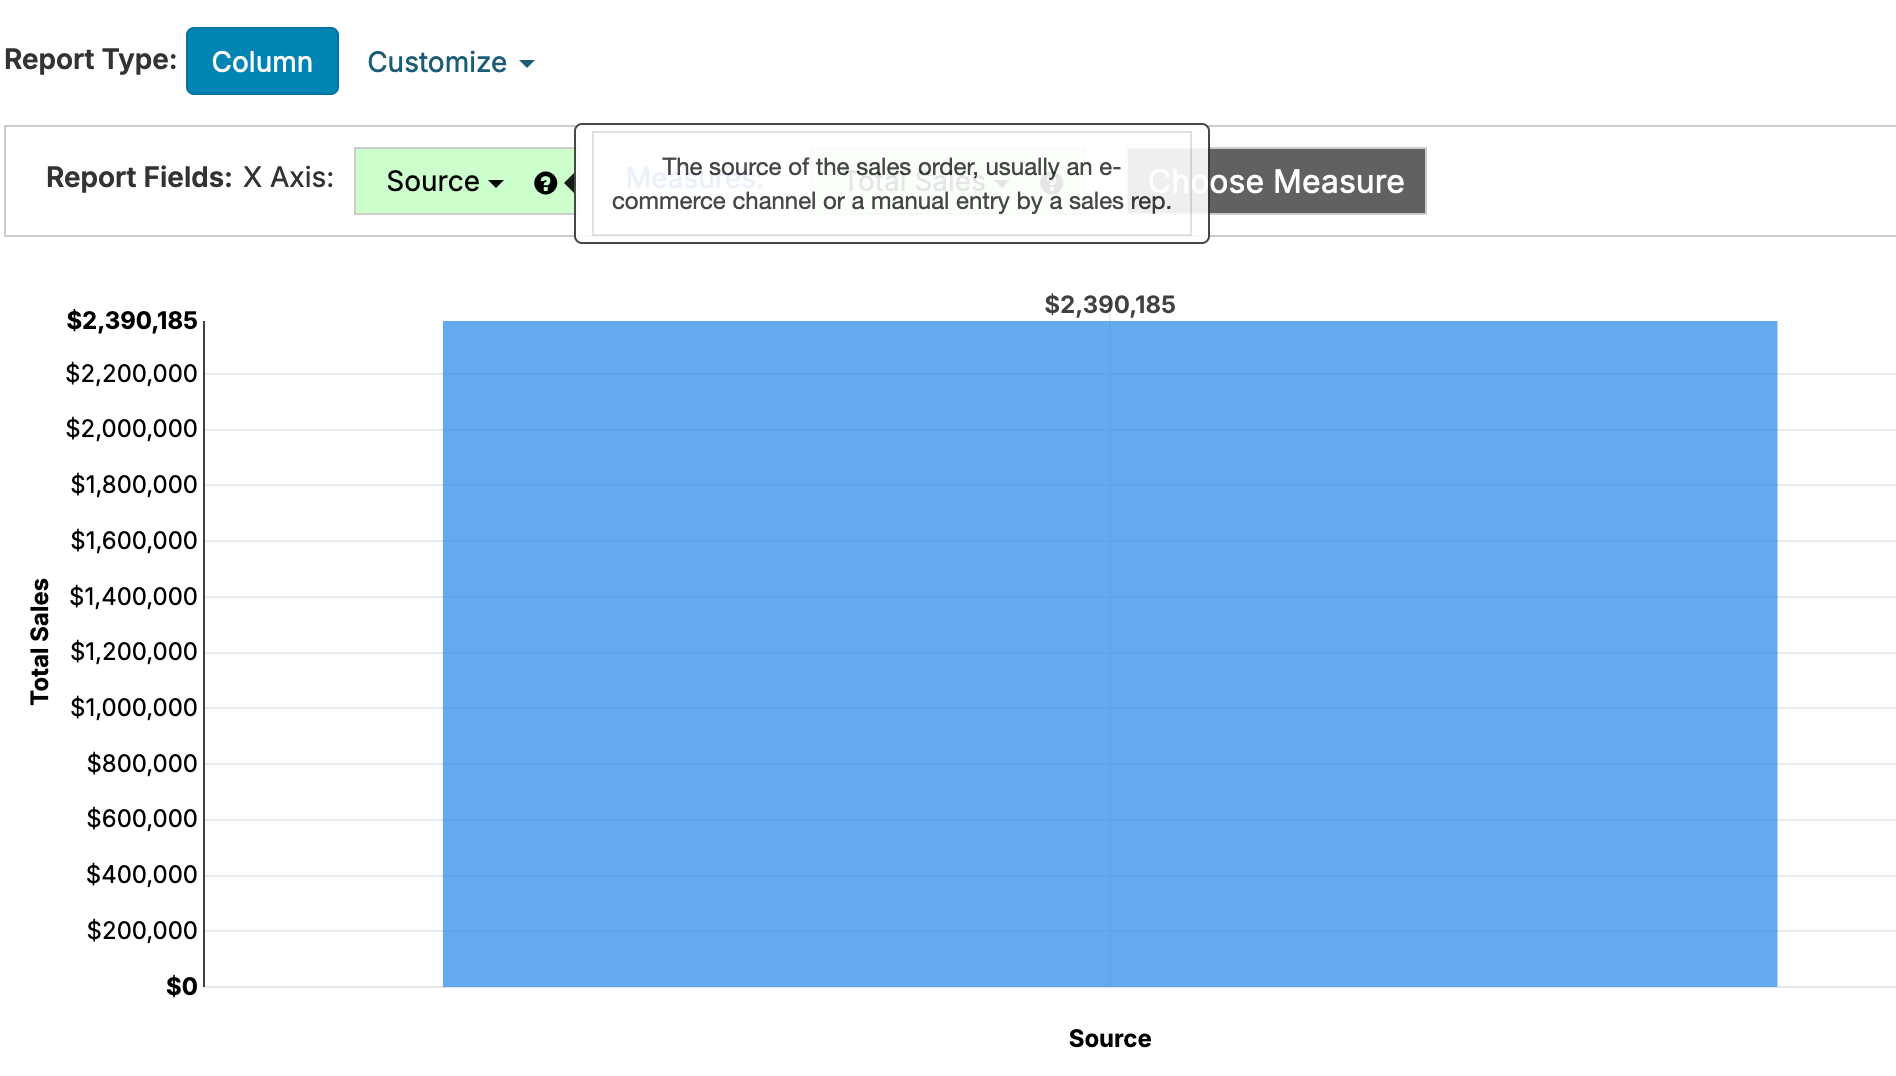
Field documentation now shows in the report editor as a tooltip next to the report field:
You can also export the full list of field documentation on your data source into a spreadsheet from the field documentation page by clicking on the Export button.
We've made a few tweaks to help with multiple field calendar reports. For example, you can use these calendars to combine sales orders, purchase orders and manufacturing orders into a single fulfillment calendar, or to add holidays and other scheduled events to a task calendar. For more information, see Calendar Reports.


