Easily combine multiple values into a single cell and color your Gantt charts.
If you have multiple assignees for a given task, multiple tags for an opportunity, or other similar scenarios, the default behavior in Easy Insight is to create a separate row for each assignee or tag. For example, the following report shows the same todo with two assignees:
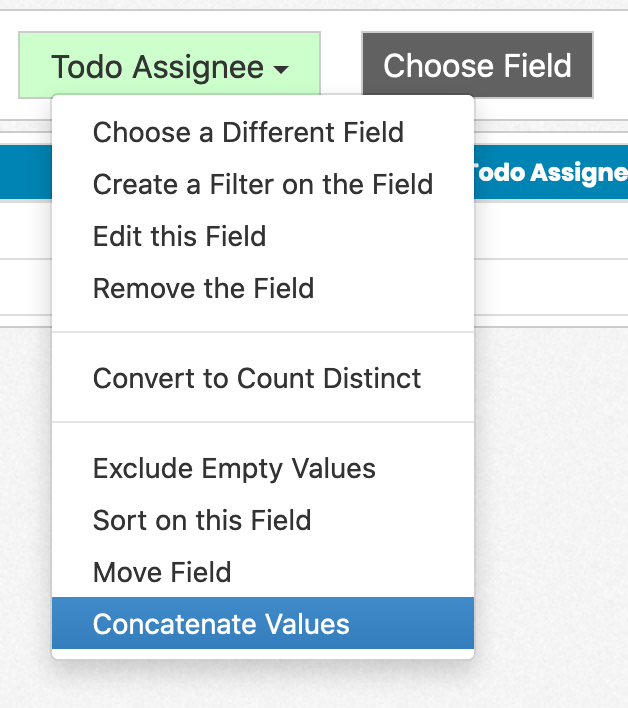
To combine these two rows, the solution until now was to use the uniqueconcat function with a custom grouping, which was a little more difficult than we liked. Instead, you can now click on the field dropdown for the assignee field and choose 'Concatenate Values' as shown below:
The result combines the two assignee values into a single cell, separated by a comma:
You can also configure the concatenation by doing Edit the Field and checking 'Concatenate Values'.
We've used this functionality to further improve Gantt charts by adding the option to specify a 'Color' field with Gantt charts. When you choose a Color field, it'll color the bars of the Gantt based on the assignee. If multiple assignees are associated to the data, it'll instead show 'Multiple':


