For this week, we have a connection to Formstack, new chart styling options, and the option to repeat grids in addition to reports within dashboards.
We've added a new connection to
Formstack to enable reports and dashboards on your form submission data. You can combine sources to create a consolidated view of multiple forms in a single dashboard.
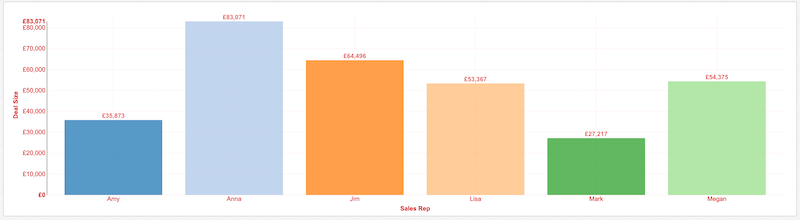
We've also added a couple of new styling options for charts. For all chart types, you can use the grid color and axis color properties to customize the grid and axis colors. You can customize these colors at a report level through Configuration -> Report Properties -> Formatting. For example, if you want red axis and grid lines, you could set those properties to get the following:
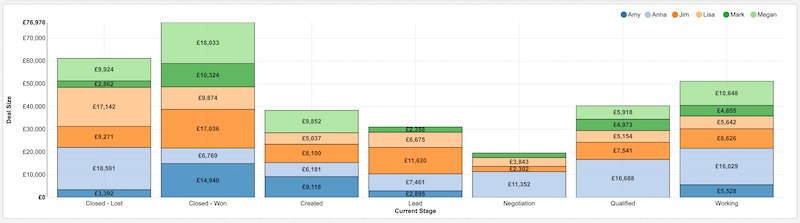
For column, bar, stacked column, and stacked bar charts, you can enable a border on the chart bars through the same Formatting section with the Border Color Enabled and Border Color properties:
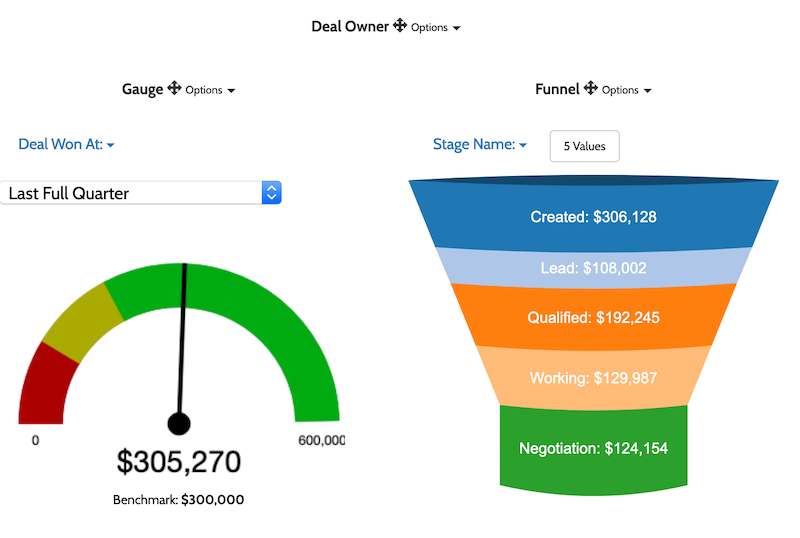
Finally for this week, you can now repeat a grid within a dashboard in addition to repeating a report. For example, you might have a sales gauge showing a sales rep's progress towards quota and a funnel chart showing the rep's current pipeline amounts. You can use the repeater to render these charts for each rep onto a single page of the dashboard.
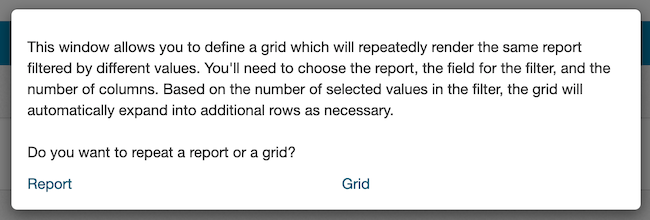
First, drag the repeater from the dashboard controls on the left or click on Choose Contents and choose Repeater. You'll be prompted to select if you're repeating a report or grid:
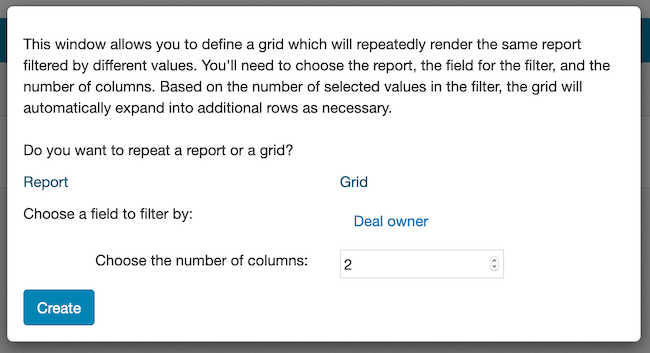
Go ahead and choose grid, then choose the field you want to repeat by. For this example, we'd choose our sales rep field. Finally, choose the dimensions for the end grid:
With the repeater set up, the next step is to add reports to the grid. In addition to the gauge and funnel, we'll also set up a text report with Sales Rep name and add that to the grid as shown:
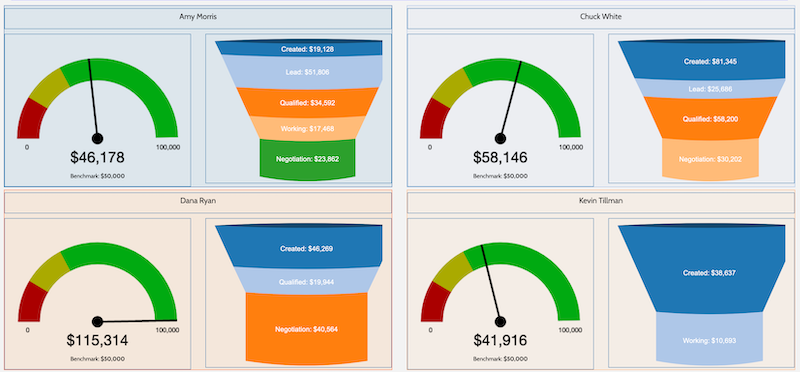
After saving and navigating to the end user of the dashboard, you'll see the grid repeated for each sales rep with data: